
The Quarter in Review | 2Q 2023
U.S. GROWTH STOCKS IGNITE GLOBAL EQUITIES IN Q2
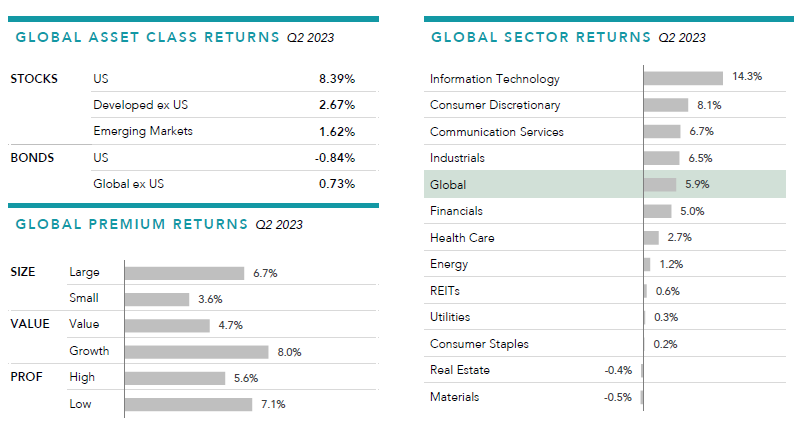
Global stocks continued to recover from last year’s drawdown, with the MSCI All Country World Index returning 6% over the quarter and outperforming global bonds for the third consecutive quarter.
Globally, information technology was the best performing sector, lifting the returns of large growth stocks, while value-oriented sectors such as energy and financials lagged the overall market. In the U.S., large growth stocks with low profitability outperformed the rest of the market. Those that performed particularly well included NVIDIA, up more than 50%, Tesla and Netflix, both of which returned over 25%.
FIXED INCOME
U.S. Treasury yields climbed higher in the second quarter as the Federal Reserve continued to raise its benchmark interest rate. After rate increases in May and July, it is anticipated that more rate hikes may be needed later this year to continue to bring inflation down. The yield curve further inverted as short-term yields rose more than long-term rates.
In terms of total returns, the High Yield Corporate Bond Index returned +1.75% for the quarter and +5.38% for the year; while the U.S. Aggregate Bond index declined -0.84% for the quarter but is still +2.09% year to date.
ALTERNATIVES
Demand worries in the U.S. and China weighed broadly on the commodities, notably metals and energy. The markets grappled with whether the Federal Reserve’s aggressive monetary policy tightening will put the U.S. into a recession.
After being the top asset class in 2022, commodities continued their year-long slide with the Bloomberg Commodity Total Return Index down another -2.56% for the quarter and -7.79% year to date. Zinc and Nickel were the worst performers for the period, declining -18.1% and -14.67% respectively.
As interest rates have started to stabilize, U.S. Real Estate Investment Trusts (REITs) continued to trend positive, up +2.92% for the quarter and +5.77% year to date. Global REITs continued to decline weighed heavily by China’s struggling property sector. Many investors are wary of the commercial property sector, wondering if it is the next shoe to drop.
ECONOMY
The first half of the year has given investors plenty to process – from banking turmoil to a morphing yield curve to the debt ceiling debate. It is interesting to note some of the financial and stock market related events that have happened so far:
U.S. Sovereign Debt downgraded for the first time since 2011.
The regional bank debacle earlier this year which led to the 2nd and 3rd largest bank collapses in U.S. banking history.
The Federal Reserve increased interest rates to the highest level in more than two decades.
The interest payment on U.S. government debt (yes, just the interest) is set to surpass $1 Trillion annually.
U.S. Household debt hit an all-time high of $17.1 trillion.
At the beginning of the year had we told you these things, few if any would have expected the S&P500 index to be up 19 percent year to date.
The surprise in some areas has been the resilience of the U.S. economy. The GDP came in better than expected with a strong 2.4% annualized gain in the second quarter. All of this has boosted consumer confidence, with the University of Michigan Consumer Sentiment Index registering a reading of 71.6 in July, well above its all-time low of 50.0 set in June 2022.
The labor market also came in stronger than expected. The unemployment rate stood at 3.6% as of the end of June, not far off from the multi-decade low of 3.3% in January 2020, prior to the COVID pandemic. That being said, some cracks under the surface are starting to appear in the labor market. Both overtime hours and the use of temporary staffing have dropped precipitously, now back to 2020 pre-COVID baseline levels.
In June 2022, seasonally adjusted year-over-year CPI inflation hit a more than 40-year high of 8.9%. Since then, inflation has declined for 12 straight months, falling to 3.1% by the end of June 2023. Indicators are that inflation may move sideways for the remainder of the year before hopefully tempering down in 2024.
LOOKING FORWARD
As we take a closer look at valuations, a good place to start is with U.S. equities. One metric wisely used to assess the valuation of the overall stock market is by looking at the price earnings ratio or P-E ratio. This is a ratio of earnings relative to the price of a company’s stock. Currently the S&P500 Index as a whole is trading at more than a 15% premium to its 25-year average.
However, as has increasingly been the case in recent years, there is a huge difference between the P-E ratio of the top 10 mega-cap stocks (Apple, Amazon, Microsoft, Google, etc) and the remaining 490 stocks that make up the overall S&P500 Index. In particular, these top 10 stocks in the S&P500 index are currently selling at a 50% premium relative to the rest of the 490 stocks in the index. It’s not unusual for there to be a sizable discrepancy, but it’s not typically this large.
It is also notable that that non-U.S. stocks (Europe, Japan, Canada) are selling at close to a 30% discount relative to the U.S. stock market. With more than double the dividend yield of U.S. stocks, international stocks can generate significant income in the short run with the potential for a sizable capital gain with a closing of a relative valuation gap, a further fall in the dollar, or both.
Recession concerns have been a fixture in the news lately, prompting many investors to wonder about what factors go into a recession announcement and how an economic downturn would impact their portfolios.
Recessions can understandably trigger worries over how markets might perform. However, investors should be aware that recession announcements are backward-looking, in contrast to the forward-looking nature of markets. Recessions are typically determined using macroeconomic indicators such as employment rates, consumption and income data, and gross domestic product growth—information that is rapidly incorporated into market prices. In fact, recessions are often officially declared after the market is already on the path to recovery.
Consistent with forward-looking expectations, average U.S. equity returns have been positive after the onset of a recession (Exhibit 1).
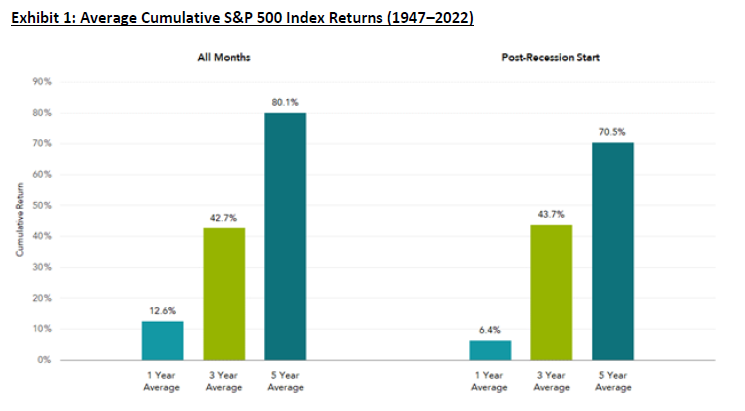
This illustrates that the S&P 500 Index had positive average returns following recession start dates that were similar to overall averages across 1-, 3- and 5-year time horizons from 1947–2022. The historical data suggests that investors can benefit from a disciplined approach that avoids making investment decisions based on lagged economic outcomes.
In short, history shows that markets incorporate expectations ahead of the news.
As an example, look back at the last global financial crisis. The official “in recession” announcement came in December 2008—a year after the recession had started. By then, stock prices had already dropped more than 40%. Although the recession ended in May 2009, the announcement came 16 months later when U.S. stocks had already rebounded.

Investors who look beyond these after-the-fact headlines about markets and the economy, and stick to a plan, will be better positioned for long-term success.
Remember, we’re here to help. This also is where the time invested upfront with each of you shows its value. Formulating a solid and adaptable financial plan together and discussing liquidity, cash flows, and reserves provides the solid footing needed for times like these with many changing facets.
We appreciate the opportunity to work with each of you. We recognize that each client’s situation is unique and incorporates different factors into their investment and financial plan.
As always, if you have any questions or concerns about current market trends and the impact on your personal situation and plan, please contact us and we would be happy to discuss.
Please follow this link to read the complete Quarterly Market Review (QMR) - Q2 2023.